| Linux Nginx 监控 | 您所在的位置:网站首页 › nginx 查看模块 › Linux Nginx 监控 |
Linux Nginx 监控
|
Nginx的基础监控
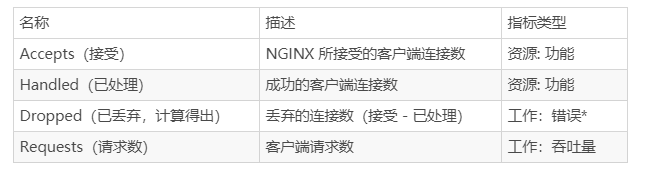
进程监控 端口监控 PS: 这两个是必须要加在zabbix监控,加触发器有问题及时告警。 web 服务器 nginx 以其高性能与抗并发能力越来越多的被用户使用 Nginx 提供了 ngx_http_stub_status_module,ngx_http_reqstat_module模块,这个模块提供了基本的监控功能。 监控的主要指标 我们需要对以下主要的指标进行监控: 1、基本活跃指标 Accepts(接受)、Handled(已处理)、Requests(请求数)是一直在增加的计数器。Active(活跃) 2、每秒请求数 – QPS 通过持续的 QPS 监控,可以立刻发现是否被恶意攻击或对服务的可用性进行评估。当问题发生时,可以在第一时间提醒环境可能出问题了【通过 QPS 不能定位到确切问题的位置】 3、服务器错误率 通过监控固定时间间隔内的错误代码,可以了解客户端收到的结果是否是正确的错误率,突然的飙升很可能是网站漏洞发出的信号 如果需要通过 access log 分析错误率,那么需要配置 nginx 的日志模块,让 nginx 将响应码写入访问日志。 3、指标的收集 通过在编译时加入 nginx 的 ngx_http_stub_status_module 模块可以实时监控以下基本的指标: nginx Stub Status 监控模块安装 先查看是否已经安装模块: # -V大写会显示版本号和模块等信息、v小写仅显示版本信息 [root@localhost ~]# nginx -V如果没有此模块,需要安装,编译命令: ./configure –with-http_stub_status_module具体的使用方法是在执行 ./configure 时,指定 --with-http_stub_status_module,然后通过配置: server { listen 80; server_name localhost; location /nginx-status { stub_status on; access_log on; } }Nginx 状态查看 配置完成后在浏览器中输入http://10.0.105.207/nginx-status 查看 (或者用 curl localhost/nginx-status),显示信息如下: Active connections: 2 server accepts handled requests 26 26 48 Reading: 0 Writing: 1 Waiting: 1 List itemStub Status 参数说明 正常情况下waiting数量是比较多的,并不能说明性能差。如果reading+writing数量比较多说明服务并发有问题。
Active connections:2 #当前nginx处理请求的数目(活跃的连接数) server accepts handled requests 26 26 48 nginx总共处理了26个连接,成功创建26次握手,也就是成功的连接数connection. 总共处理了48个请求 失败连接=(总连接数-成功连接数)(相等表示中间没有失败的), Reqstat 模块监控 ----已经不支持了(需要导入) 描述 ngx_http_reqstat_module 模块 这个模块计算定义的变量,根据变量值分别统计 nginx 的运行状况。 可以监视的运行状况有:连接数、请求数、各种响应码范围的请求数、输入输出流量、rt、upstream访问等。 可以指定获取所有监控结果或者一部分监控结果。 利用变量添加自定义监控状态。总的监控状态最大个数为50个。 回收过期的监控数据。 设置输出格式 跟踪请求,不受内部跳转的影响 不要使用与响应相关的变量作为条件,比如"$status" 现在通过ngx_req_status_module能够统计Nginx中请求的状态信息。需要安装第三方模块 安装模块: tengine官方说req-status模块默认安装。但是并没有。从github引入第三方模块解决该问题 yum与编译安装的nginx扩展模块安装: [root@nginx-server ~]# yum install -y unzip 1. 安装,先查看一下当前编译安装nginx的版本 [root@localhost nginx-1.16.0]# nginx -V 下载或者上传一个和当前的nginx版本一样的nginx的tar包。 [root@nginx-server ~]# tar xzf nginx-1.16.0.tar.gz -C /usr/local/ 2.下载ngx_req_status_module 模块, 这是第三方模块需要添加 [root@nginx-server ~]# wget https://github.com/zls0424/ngx_req_status/archive/master.zip -O ngx_req_status.zip [root@nginx-server ~]# unzip ngx_req_status.zip [root@nginx-server ~]# cp -r ngx_req_status-master/ /usr/local/ #与解压的nginx在同一级目录下 [root@nginx-server ~]# cd /usr/local/nginx-1.16.0/ [root@nginx-server nginx-1.16.0]# yum -y install pcre pcre-devel openssl openssl-devel gcc gcc-c++ zlib zlib-devel [root@nginx-server nginx-1.16.0]# yum -y install patch.x86_64 [root@nginx-server nginx-1.16.0]# patch -p1 < ../ngx_req_status-master/write_filter-1.7.11.patch [root@localhost nginx-1.16.0]# ./configure 添加上原来的参数 --add-module=/usr/local/ngx_req_status-master [root@localhost nginx-1.16.0]# make 由于原先已有nginx,所以不能执行make install,否则会覆盖掉以前的配置文件及内容 [root@localhost nginx-1.16.0]# mv /usr/sbin/nginx /usr/sbin/nginx_bak [root@localhost nginx-1.16.0]# cp objs/nginx /usr/sbin/ [root@localhost nginx-1.16.0]# systemctl restart nginx [root@localhost nginx-1.16.0]# nginx -V 如果发现编译的配置文件有变化就成功了! 配置如下: 需要在http里面配置。 [root@localhost ~]# vim /etc/nginx/nginx.conf req_status_zone server_name $server_name 256k; req_status_zone server_addr $server_addr 256k; req_status_zone server_url $server_name$uri 256k; req_status server_name server_addr server_url; server { listen 80; server_name localhost; location /req-status { req_status_show on; } } 指令介绍 req_status_zone 语法: req_status_zone name string size 默认值: None 配置块: http 定义请求状态ZONE,请求按照string分组来排列,例如: req_status_zone server_url $server_name$uri 256k; 域名+uri将会形成一条数据,可以看到所有url的带宽,流量,访问数 req_status 语法: req_status zone1[ zone2] 默认值: None 配置块: http, server, location 在location中启用请求状态,你可以指定更多zones。 req_status_show 语法: req_status_show on 默认值: None 配置块: location 在当前位置启用请求状态处理程序
zone_name - 利用req_status_zone定义的分组标准。例如,按照服务器名称对请求进行分组后; key -请求按分组标准分组后的分组标识(即组名)。例如按服务器名称分组时,组名可能是localhost; max_active -该组的最大并发连接数; max_bw - 该组的最大带宽; traffic - 该组的总流量; requests - 该组的总请求数; active - 该组当前的并发连接数; bandwidth - 该组当前带宽。 补充(扩展): nginx access log 分析 nginx 的 access log 中可以记录很多有价值的信息,通过分析 access log,可以收集到很多指标 制作nginx的日志切割,每天凌晨切割并压缩。PV:PV(访问量): 即Page View, 即页面浏览量或点击量,用户每次刷新即被计算一次。 UV:UV(独立访客):即Unique Visitor,访问网站的一台电脑客户端为一个访客。00:00-24:00内相同的客户端只被计算一次。 |


【本文地址】